How the UK’s new Tree Equity Score map can be the basis for change

Carrie Hume, Development & Partnerships Director at Trees for Cities, discusses how we can best utilise the Tree Equity Score UK map, created to help address disparities in urban tree distribution.
Today marks the launch of a new map detailing the UK’s Tree Equity Score. It is based on work by American Forests in the US that successfully brings into focus the fact that many of the communities in most need of trees for health and climate resilience purposes have the least existing tree cover. Those are the places that need the most focused attention and investment, otherwise, when it gets hotter in towns and cities those people will suffer the most. That does not seem fair and is largely avoidable with targeted measures that include boosting the number of trees in their neighbourhood.
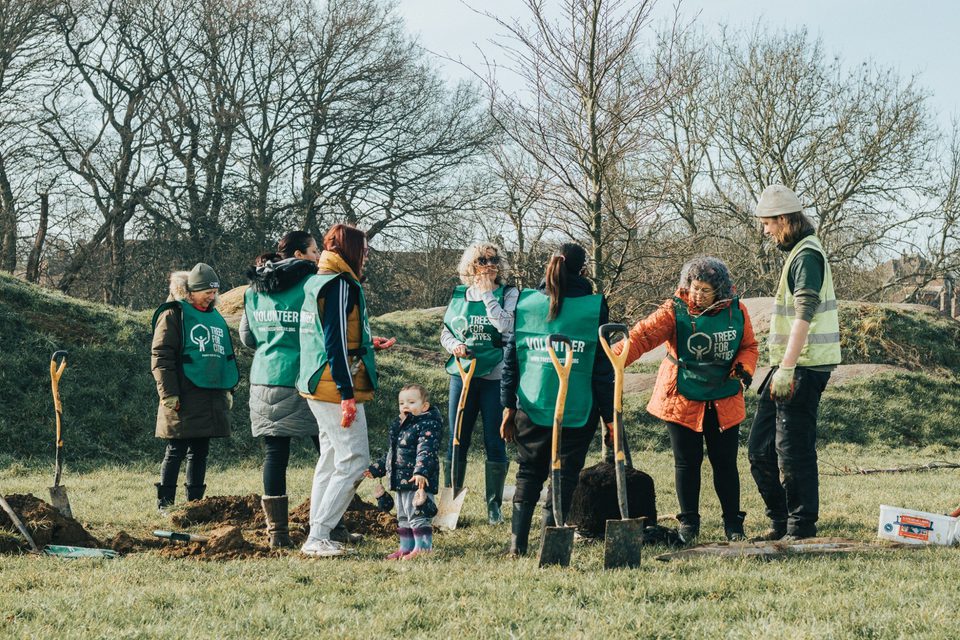
Trees are demonstrably successful at cooling urban areas, and offer an accessible form of environmental activism for many if provided with the guidance and skills investment needed for long-term tree establishment.
Congratulations to American Forests for their pioneering work to develop and underpin ‘Tree Equity’, and to the Woodland Trust and Centre for Sustainable Healthcare for helping to develop a version we can use in the UK context.
How can we make the most of the map?
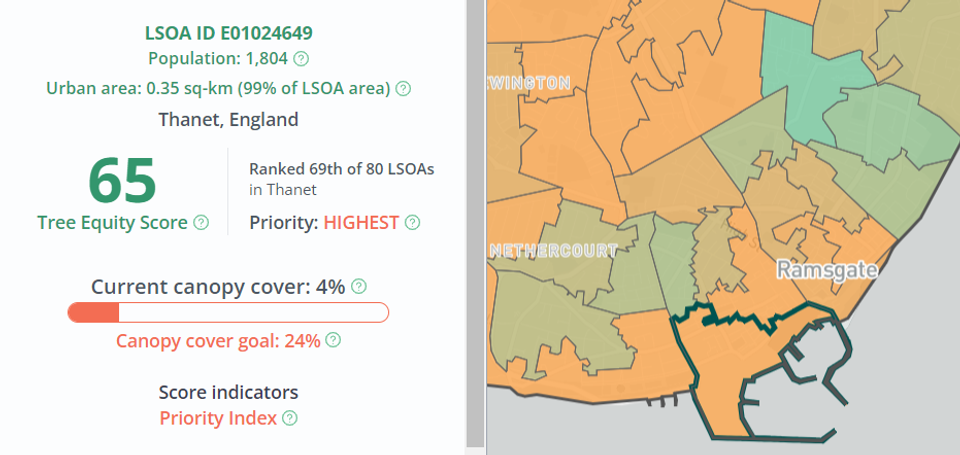
Firstly, have a good look at the map and learn about the UK situation. Tree Equity scores show not only where existing tree canopy cover is low, but where the communities are that would most benefit from increasing urban tree canopy cover. You’ll learn a few things no doubt, and start to see correlations with other social and environmental issues from your own knowledge, like how low canopy areas coincide with low life expectancy.
The map feels pretty familiar at Trees for Cities, where we’ve been homing in on areas with low tree canopy cover (the main driver of the tree equity scores) and high areas of social deprivation (measured by Index of Multiple Deprivation) since our inception 30 years ago.
It’s why we established our Forgotten Places projects where we did – those areas stand out proud on this map, places like Great Yarmouth, Bexhill and Ramsgate which are particularly vulnerable to climate change and often linked to cycles of social and environmental decline (see professor Chris Whitty's report).
But we haven’t used a unified map like this before, and so we will be using this information to further help target where we work and why, before using more detailed information to work out the art of the possible with partners and communities at the local level.
Promote across sectors
Secondly, let’s all promote the map and tree equity principles, and what they tell us across the environment and health sectors, and beyond. With different sectors looking to improve local quality of life through planting, protecting and promoting trees, conversations between organisations are often fruitful and are increasingly helping to align effort and create a common cause.
The simple message that by working with trees we can in time reduce sickness and deaths in the most vulnerable, especially as our climate warms up, is a powerful one. It could unlock more conversations and connections about where to target effort and investment. Is the funding community aware of the need to align around the principles of tree equity, and are they coercing cross-sector collaboration to get trees where they are needed most? What different conversations will you now have off the back of this map?
Discuss with decision makers
Thirdly, talk to decision-makers about why tree equity matters and what steps they can take to turn the situation around. Maps are inherently engaging and tell a powerful visual story, so let’s use that to build out a narrative around this map that explains what’s going on, why interventions are needed and what those could be. We can then identify together where policy change and investment is needed to make real change on the ground and where more detailed data and insights are needed.
Can we set up some pilot projects that really bring the story to life, championing the voice and involvement of communities along the way, and establish route maps out of low tree equity scores towards high ones? Decision-makers would find it hard to dodge such compelling information. We are already half-way there with many projects, we just haven't cast them in this light before. Five pilot projects for five years could really get to the bottom of this whilst demonstrably turning tree equity around.
Equip communities with essential knowledge
Fourth, but most significantly, let’s use this map to ensure communities in need are aware of how low their tree canopy cover is, and of how boosting tree canopy cover will help them and their communities secure improved health and coping strategies during the climate emergency.
Empowerment of communities in need requires careful engagement, deep listening and inevitably capacity building in various forms. The American approach took many of these steps and so looks and feels like a change campaign, foregrounding the voices and experiences of communities and of their journeys and success stories.
What would it take to develop impactful campaigns for change in the UK off the back of these tree equity scores? In the UK we are fortunate in having relatively buoyant funding strands for establishing trees, still high levels of political and public good will towards trees, but we can definitely go further for the people who need trees the most. Who would lead such a campaign?
From maps to real change
Delivering change requires moving from maps towards increasing detail and partnership working, but this map is a powerful tool in pointing the way and highlighting the issue of tree equity.
Talk to the people behind these maps, and to Trees for Cities about how we can help given the tools (see for example our coastal planting guide) and community links we have established over the years. There are many possibilities emerging from these kinds of maps where Trees for Cities can continue to create positive change together with partners and funders. Our history speaks to the cause, and our future will no doubt be guided by principles of tree equity for some time to come.
Check out the UK’s Tree Equity Score map and see how our Forgotten Places project has helped green numerous coastal communities with low canopy cover across the UK.

Donate to Trees for Cities and together we can create leafy, liveable cities now and for future generations.
Donate